Friday 27 March 2015

Why ‘Doing’ and ‘Done’ in the Kanban board?

Visual Studio Online introduced this feature a few weeks ago, and then I’ve been asked…

Why is the split column inside another column?

That is absolutely a fair question.

image 

Kanban rotates around the concept of Capacity Flow, minimizing turnover and cycle time.

The so called ‘Kanban Boards’ – the Backlog Boards in reality - in Visual Studio Online take this principles as foundational when it is time to present an aggregated view of the development situation. Capacity is immutable by definition, unless there is an external intervention.

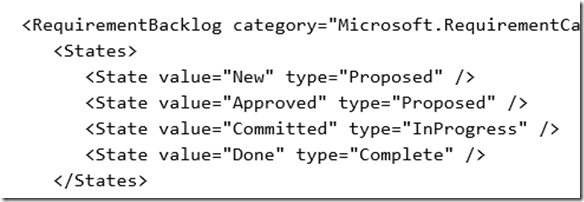
Also note that the we are not looking at the same stuff. The Sprint Backlog Board will boast the true States of my involved Work Items, which are then mapped to the Kanban Boards’ Metastates. Here is an example:

image

This is my Process Template. But my board looks like this:

image

What happens is that regardless of the Metastate (between New and Approved) the actual Work Item State is still Proposed. A Metastate is basically a way of determining how it is visualised, given that all the constraints are valid of course.

But back to the original question – does it make sense?
It does, indeed. These feature might seem just cosmetic stuff, but they actually contribute a lot in keeping the teams’ meeting lean and the procedures simple and effective.

Even if a PBI is Approved, it still might have work on it. Hence separating the Doing/Done phases makes it way easier for the Product Owner to understand the actual pace of the team. This works very well with the Definition of Done on the board, which I covered on this post.

Tuesday 17 March 2015

Definition of Done on the Boards – how, and my thoughts on why

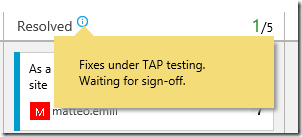
Last week Microsoft rolled on the latest Visual Studio Online sprint deployment, and among all the new features there is the possibility of adding a visualisation of the Definition of Done in the Kanban Board.

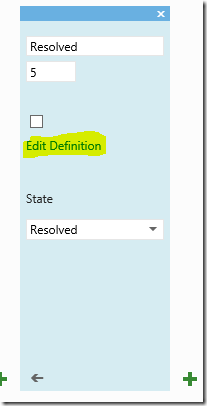
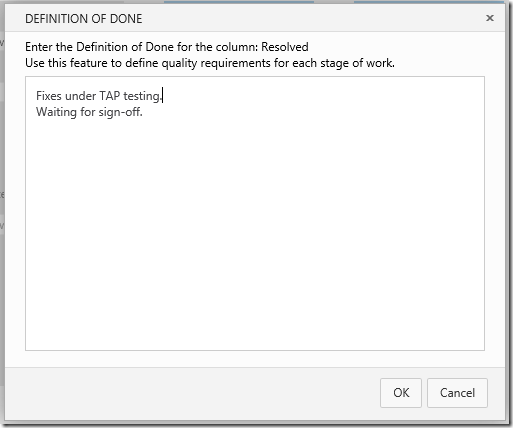
How? It’s very easy, you click on Customize columns in the board, and you add the DoD for each column you want to add it to:

image image image

image

Easy as chips. But where is the real value of this (very welcomed) feature? Why is it that good for me?

Step back from your role a minute, and think. What is the Definition of Done?

The DoD is usually a clear and concise list of requirements that a software Increment must adhere to for the team to call it complete.

That said, the Boards are meant for team’s consumption, hence reporting the DoD in a shared, neutral tool is an amazing way of pushing the concept of the Definition of Done itself. It is under everybody’s eyes and it doesn’t leave space for interpretation, so it enforces how to properly relate to it.

Monday 9 March 2015

A lap around the new Application Insights

I really like Application Insights – it is no mystery, just look at how many posts I wrote on it – and the last time I purposely played with it was around 2013.3 last September, with the 2.0 version approaching the release and a complete under the hood rewrite to fit into Microsoft Azure.

Well, a lot changed in the last six months…let’s start from scratch: we have a Web Site running, we want to add Application Insights as the production monitoring solution.
0

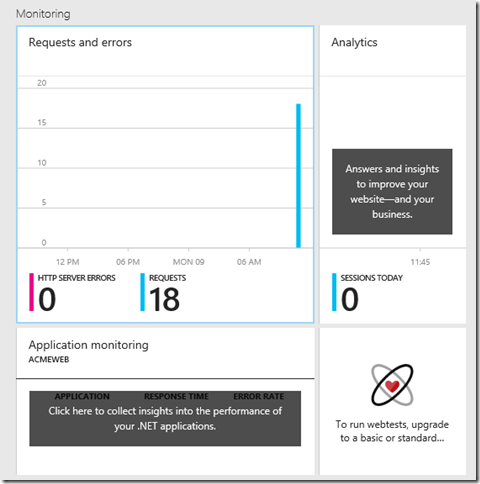
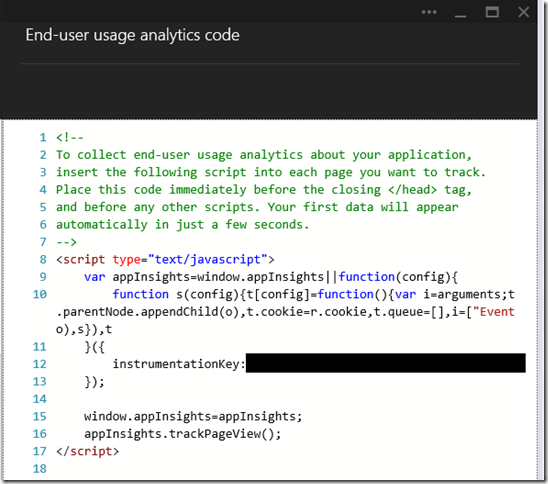
You are running on Azure, so the request monitoring is implemented out-of-the-box. No configuration, no code changes – it is offered as part of the Azure infrastructure. If we want to monitor the actual end-user usage, we need to add a bit of JavaScript to your pages:
 1

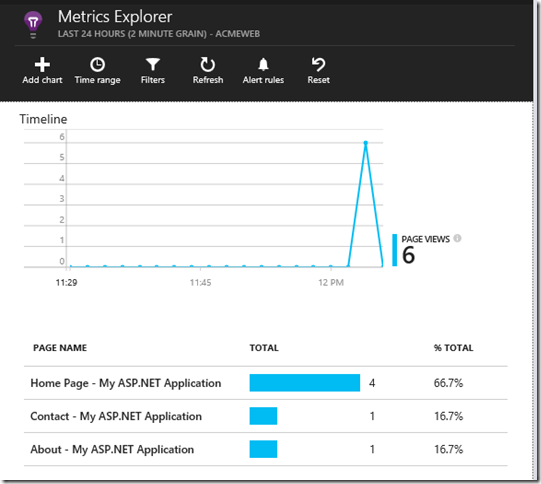
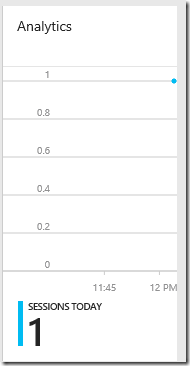
Doing this will enable the usage monitoring. You are going to notice how fast and sleek Application Insights is now compared to the old Visual Studio Online implementation, it is a matter of a couple of minutes at worst and you are going to look at your freshly fetched data:
2

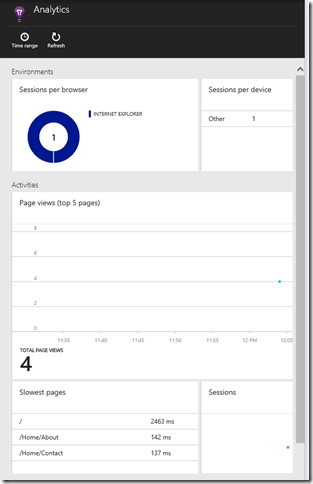
Obviously you can dig into this data – it is a monitoring platform after all!
 3 4

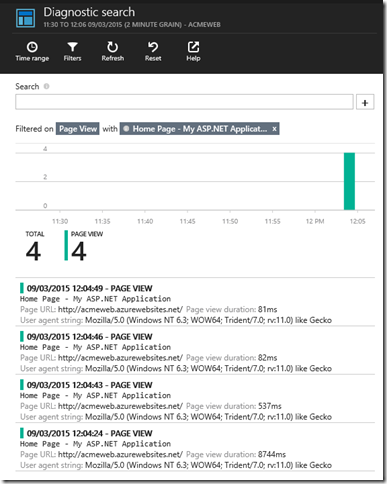
The Diagnostic search is very cool because it is a pre-filtered, context-based series of charting which enables troubleshooting and diagnostic scenarios with a couple of clicks. For instance here I can access the details of a page’s status in a certain session:
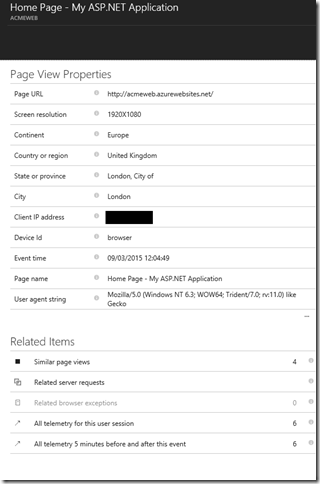
5 6

subsequently, I might want to see the telemetry for the whole session:
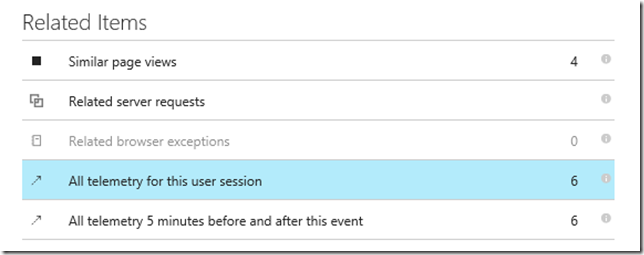
7

so looking at what this user did, in case I am inspecting a suspect behaviour on a bug report:
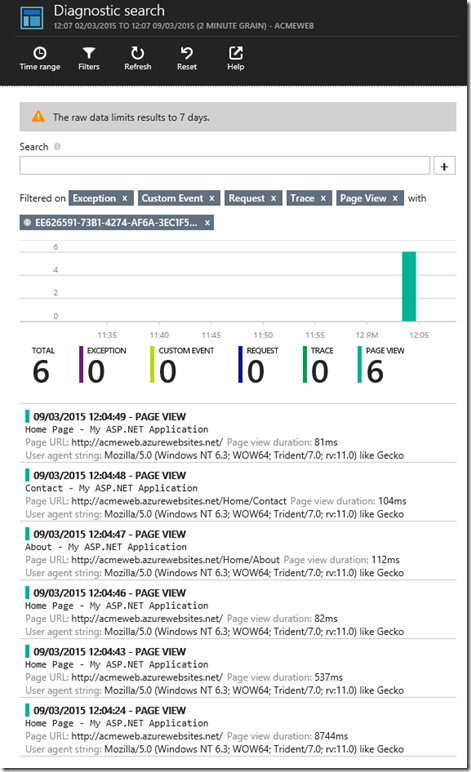
8

The other option is on a timeframe, so looking at the ten minutes interval around the event I scoped my search on:
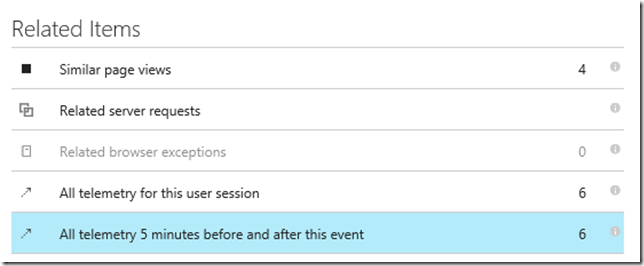
9 

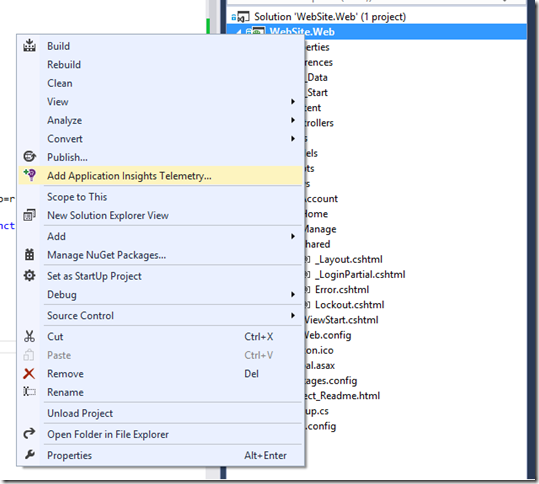
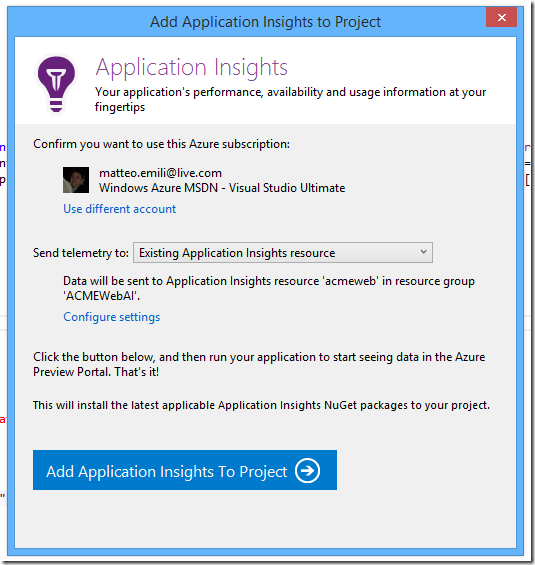
Moving on to the health and performance monitoring, you need the Application Insights Telemetry, a two-click operation in Visual Studio which is going to lead to a new NuGet package installed in my solution:
 14 

15

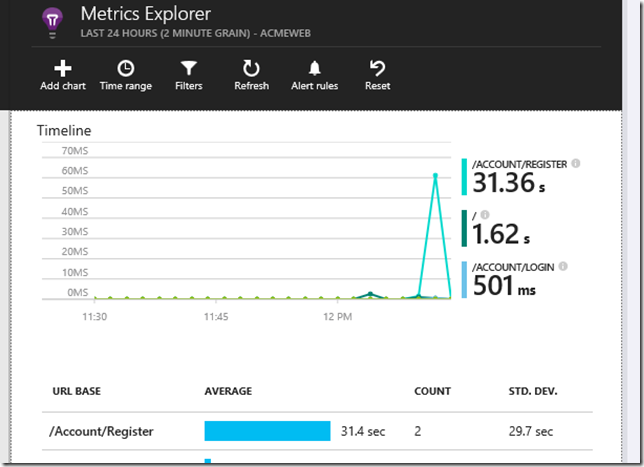
So I can enabled scenarios like this - I have a troublesome page here:

11

I can dig into the Metrics Explorer, and look at the stats – each event is reportable and will boast a number of properties you can use to investigate.
 12


If you want to log custom events, it is a matter of using the same appInsights object created by the existing snippet and model what you need to log. For example, I might want to log an event with two properties, a string and an integer:

 17

and out-of-the-box I would get support for sorting and aggregating my custom properties in the charts:

18 2019 

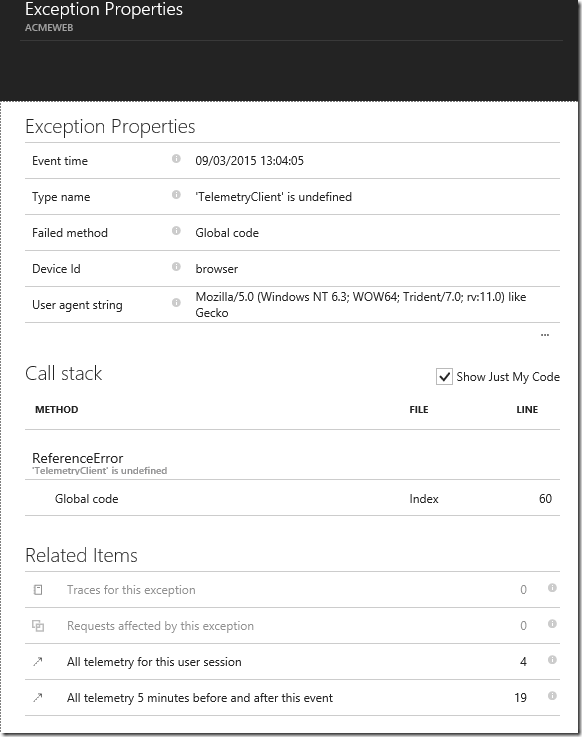
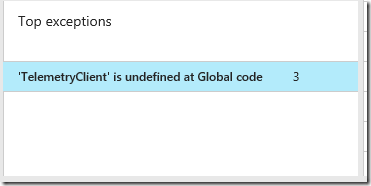
To be fair, I really like the workflow provided by the Azure Portal’s blades. Let’s say I have an exception:
 

21

For each level I dig into, a blade opens, so I can easily keep track of the workflow I am following. Very good use for all these 16:9 screens around :) 22
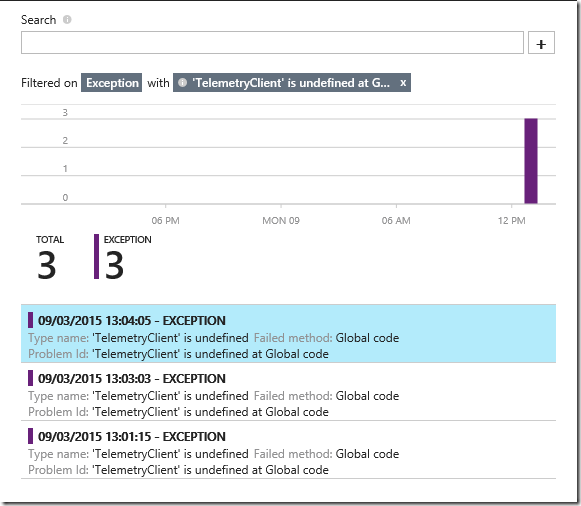
23

The Properties blade is the same for each event, so I can retrieve the relevant telemetry in any case. My users for example behaved like this:
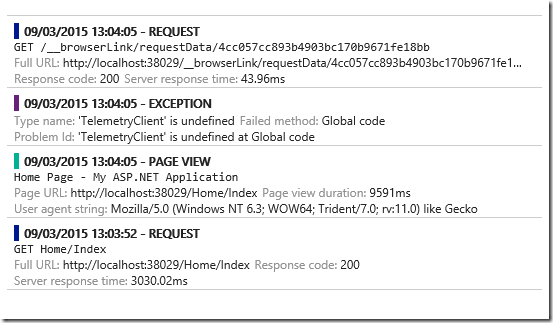
24

It’s a matter of seconds understanding where this issue is.

But what if you want more logs? Mostly important, more logs at lower levels? Here they are:
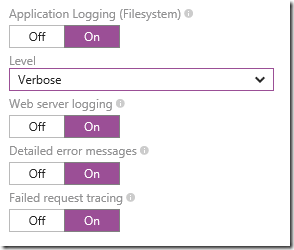
25

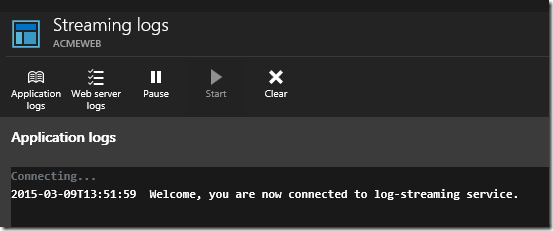
Eventually, you get live streaming of the Application and Web Server Logs:
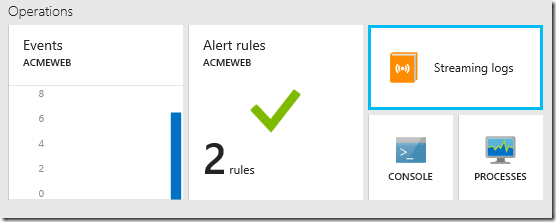
26

27

28

This is actually quite verbose because I set it so, but you have four options to choose from…

The new Application Insights is more promising than ever – I am seriously impressed by the effort the team spent on it, Application Insights now feels very solid and it sports even more data than before, without mentioning how integrated it is with Azure.

Thursday 5 March 2015

Why can’t I output the result of git log from a PowerShell script?

Git log is a special command, it uses a pager and it seems the PowerShell ISE hangs when you run into that kind of commands. If you try creating a script relying on running git log in whatever form, you won’t get anything.

The workaround is not the very best, but it does the trick:

$logcommand = "git --no-pager log ... [> file.ext if needed]"
Invoke-Expression $log

Other commands like git diff are not affected by this. This made me lose quite a bit of time this morning…but I am happy to be unblocked now.